
This Wednesday, the Commerce Department will publish the February data on the United States’ international trade in goods and services. This latest release comes just three weeks after the January report, which was delayed due to the government shutdown. Here are five things to keep in mind for these upcoming numbers.
1. The Trade Deficit: Will it stay, or will it grow?
The U.S. trade deficit shrunk sharply in January, surprising economists. Exports grew to 0.9% to $207.3 billion while imports fell 2.6% to $258.5 billion. The deficit’s narrowing was mainly attributed to plummeting imports from China and a slowing domestic economy.
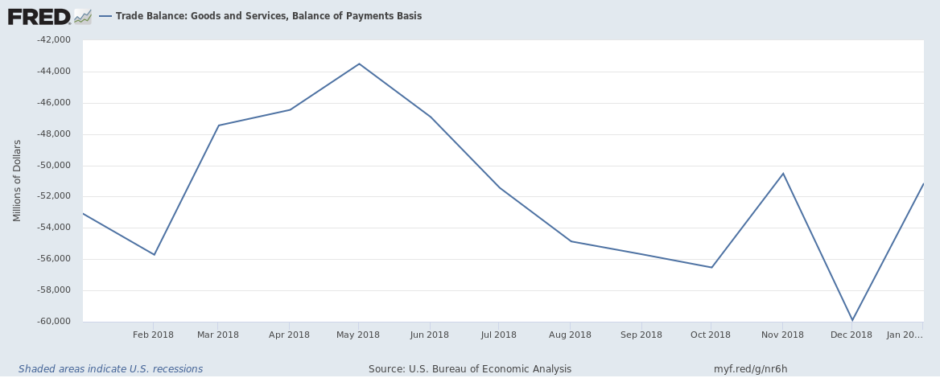
Economists don’t expect this shrinkage to continue—those surveyed by Bloomberg gave an average estimate of $53.3 billion for the February trade deficit, an increase of 4% from January. However, this estimate comes in lower than the decade-high deficit of $59.8 billion posted in December.
“We’re looking for a little bit of a widening in the trade deficit for the month of February after actually a big improvement in January,” said Douglas Porter, an economist at the Bank of Montreal. “It probably will fit with an overall picture of quite sluggish growth at the start of 2019.”
A cooling global economy that diminishes demand for American goods and higher import prices in February are expected to be main drivers in widening the deficit. A bigger trade deficit could also shave more off of the U.S.’s GDP.
2. Fragile China
The U.S.’s trade deficit with its biggest trading partner also narrowed in January as imports from the country dropped. Economists attributed the unexpected numbers to volatility caused by the Lunar New Year and changes in U.S. import behavior because of President Donald Trump’s trade war with China.
Scott J. Brown, an economist at Raymond James & Associates, said that in December, “you may have had a lot of front-loading in imports from China from the U.S. trying to stockpile parts and materials ahead of what were expected to be tariff increases.”
After this December surge, imports to the U.S. from China fell 12.3% to $40.8 billion in January. However, U.S. exports to China also decreased to 3% to $7.5 billion. With a slowing Chinese economy, it’s likely that demand for U.S. goods will continue to fall.
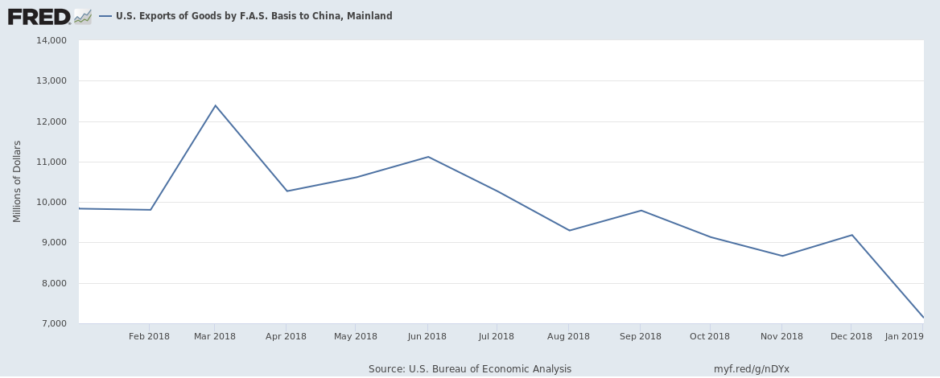
The February data can reveal whether the relationship between the world’s two biggest trading partners has stabilized during a tumultuous trade war or whether it’s only weakening further.
3. Soybean Story
Soybeans have made headlines during the U.S.-China trade war as symbol of the tensions between the two nations. In 2018, China sharply cut its imports of U.S. soybeans in response to Trump’s tariffs, hurting U.S. farmers. However, soybean exports jumped 300% in January to $1.21 billion as China committed to purchasing more of the agricultural product.
The February data will show whether soybean exports will continue to climb. Low numbers would show that the harmful effects of Trump’s trade war on American farmers are more lasting than expected.
4. Energy Estimates
The rise of the U.S. as a major oil exporter has been a big trade story in the past year. Between 2017 and 2018, American crude oil exports more than doubled. In 2018, the U.S. surpassed Russia as the world’s largest oil producer.
In January, oil imports to the U.S. decreased 13% to $9.2 billion, but exports also fell 4% to $4.3 billion. The February data will show how the U.S. continues to fare as an oil producer and consumer.
5. Car Trouble
The U.S. auto industry has had its challenges, particularly as an exporter.
“We are seeing a slow but steady cooldown in U.S. auto sales,” said Porter. “The truth is that they basically peaked a few years ago.”
However, in January, exports of automotive vehicles, parts and engines increased 10% to $13.5 billion. Continued improvement in February could signal the start of redemption for this struggling industry.


